Presidio Property Trust, Inc. Announces Earnings for the Quarter Ended March 31, 2026
News > Real Estate News

Audio By Carbonatix
3:00 PM on Friday, May 15
The Associated Press
SAN DIEGO, CA / ACCESS Newswire / May 15, 2026 / Presidio Property Trust, Inc. (Nasdaq:SQFT, SQFTP, SQFTW) (the "Company"), an internally managed, diversified real estate investment trust ("REIT"), today reported earnings for its quarter ended March 31, 2026.
"We continue to seek suitable model home investment opportunities with builders in market areas we believe have upside potential. Those opportunities in market areas with strong employment in technology, artificial intelligence (AI), and industrial automation are of particular interest," said Steve Hightower, President of the Model Home Division.
"Our strategic evaluation of our commercial portfolio continues, as we focus on maximizing value through leasing and consider future sell/hold/buy potential. As with 2025, our tenant retention through the First Quarter has been excellent" said Gary Katz, the Company's Chief Investment Officer.
The Quarter Ended March 31, 2026, Financial Results
Net loss attributable to the Company's common stockholders for the three months ended March 31, 2026 was approximately $(129,632), or $(0.10) per basic and diluted share, compared to a net income of approximately $1.7 million, or $1.31 per basic and diluted share for the three months ended March 31, 2025. The change in net income attributable to the Company's common stockholders was a result of:
|
|
|
|
|
|
FFO (non-GAAP) totaled approximately ($2.1 million) and ($1.2 million) for the three months ended March 31, 2026 and 2025, respectively. A reconciliation of FFO to net loss, the most directly comparable GAAP financial measure, is attached to this press release. However, because FFO excludes depreciation and amortization as well as the changes in the value of the Company's properties that result from use or market conditions, each of which have real economic effects and could materially impact the Company's results from operations, the utility of FFO as a measure of the Company's performance is limited.
We believe Core FFO (non-GAAP) provides a useful metric in comparing operations between reporting periods and in assessing the sustainability of our ongoing operating performance. Core FFO decreased by about $0.9 million, from approximately ($1.0 million) for the three months ended March 31, 2025, to approximately ($1.9 million) for the three months ended March 31, 2026. A reconciliation of Core FFO to net income, the most directly comparable GAAP financial measure, is attached to this press release.
Acquisitions during the three months ended March 31, 2026:
|
Dispositions during the three months ended March 31, 2026:
|
|
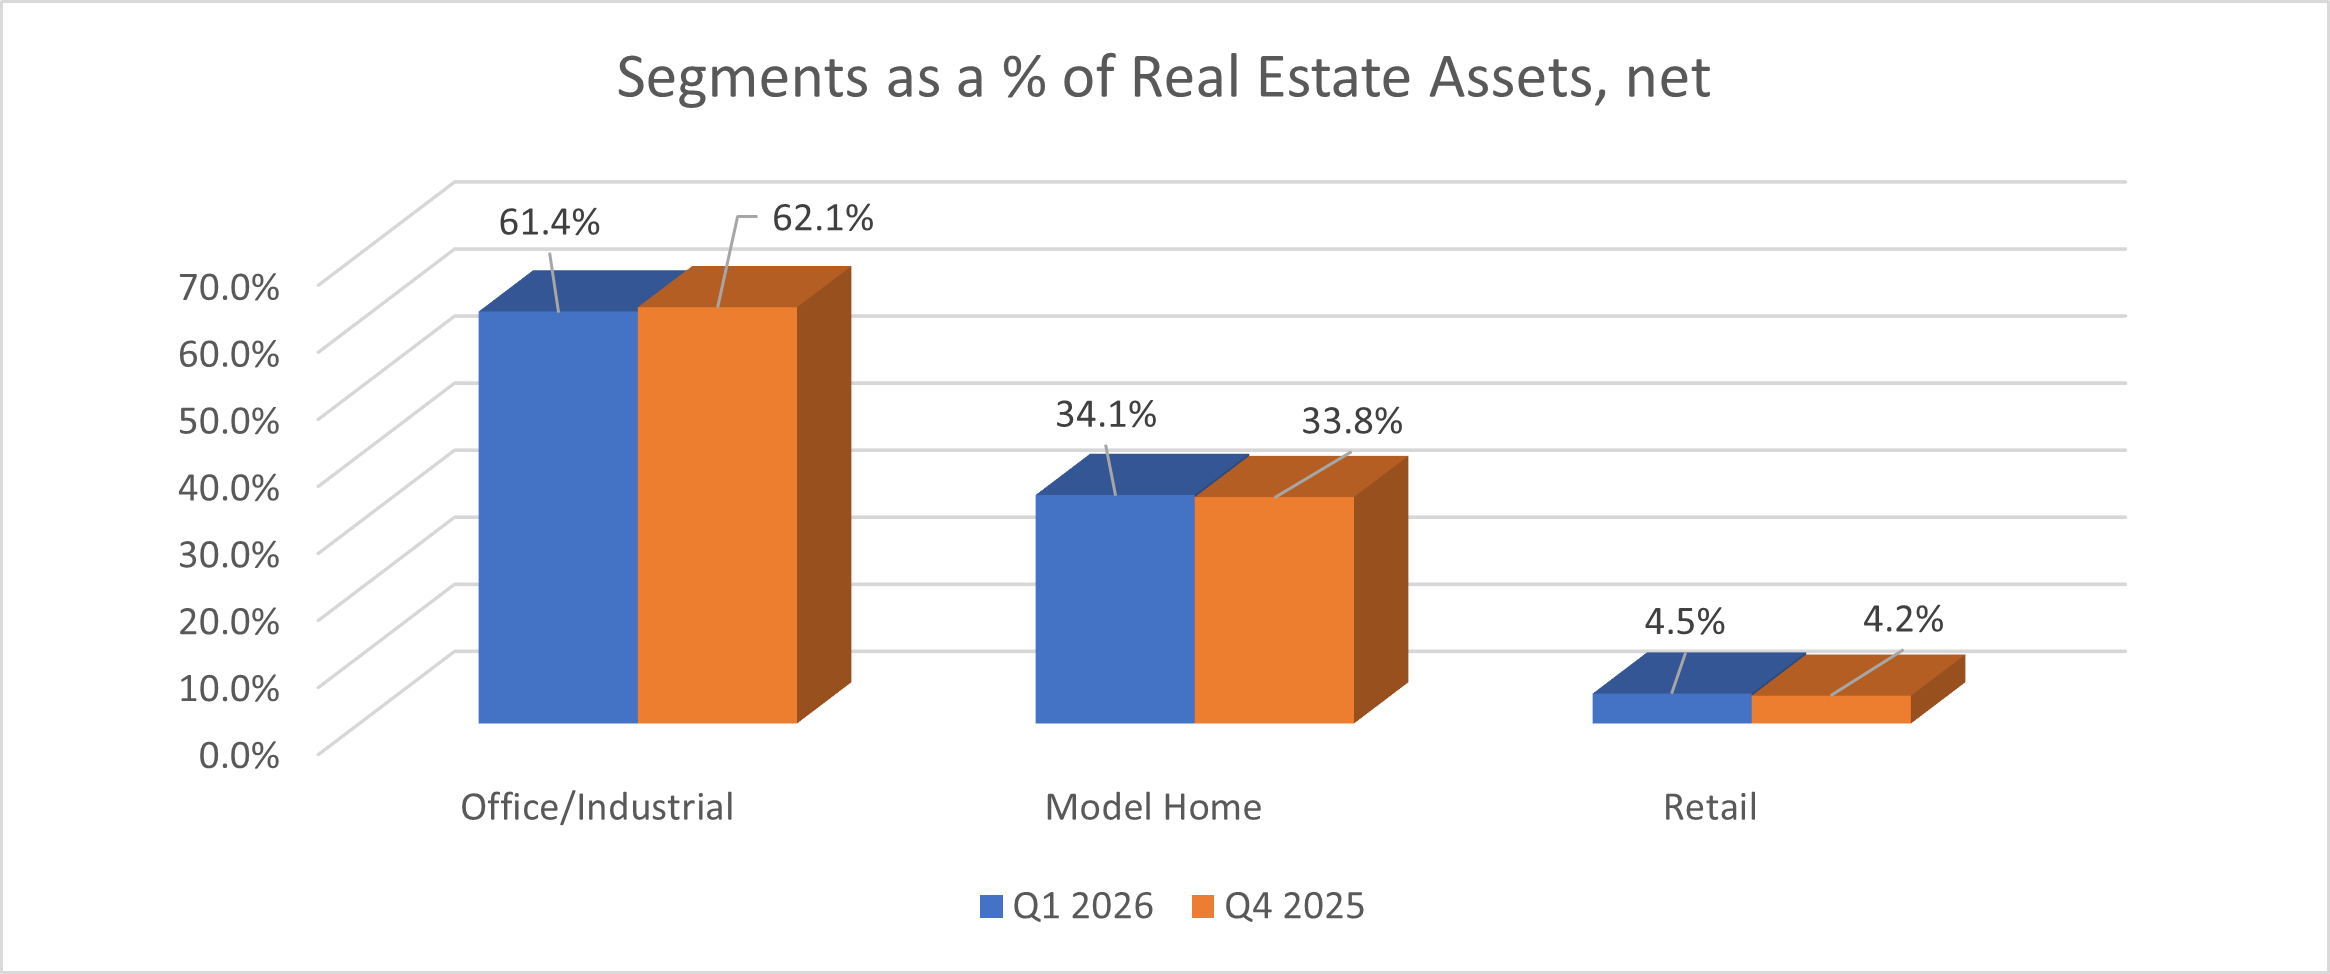
Segment Income during the three months ended March 31, 2026:
The following tables compare the Company's segment activity and NOI and adjusted NOI for Model Home income to its results of operations and financial position as of and for the three months ended March 31, 2026. The line items listed in the below NOI tables include the significant expense considered by the CODM for cash allocations on future investments. The Other Non-Segment & Consolidating Items represent corporate activity, the investment in Conduit Pharmaceutical, and other eliminating items for consolidation. The information for Corporate and Other are presented to reconcile back to the consolidated statement of operations, but is not considered a reportable segment. This includes the loss on Conduit marketable securities.
The following tables compare the Company's segment activity to its results of operations and financial position as of and for the three months ended March 31, 2026:
For the Three Months Ended March 31, 2026 | ||||||||||||||||||||
Retail | Office/Industrial | Model Homes | Corporate and Other | Total | ||||||||||||||||
Rental revenue | $ | 93,574 | $ | 2,234,494 | $ | 919,890 | $ | - | $ | 3,247,958 | ||||||||||
Recovery revenue | - | 436,086 | - | - | 436,086 | |||||||||||||||
Other operating revenue | - | 82,800 | 5,534 | 422 | 88,756 | |||||||||||||||
Total revenues | 93,574 | 2,753,380 | 925,424 | 422 | 3,772,800 | |||||||||||||||
Rental operating costs | 4,832 | 1,630,837 | 48,877 | (140,105 | ) | 1,544,441 | ||||||||||||||
Net Operating Income (NOI) | 88,742 | 1,122,543 | 876,547 | 140,527 | 2,228,359 | |||||||||||||||
Gain on Sale - Model Homes | - | - | 172,096 | - | 172,096 | |||||||||||||||
Impairment of Model Homes | - | - | (75,639 | ) | - | (75,639 | ) | |||||||||||||
Adjusted NOI | $ | 88,742 | $ | 1,122,543 | $ | 973,004 | $ | 140,527 | $ | 2,324,816 |
The CODM reviews on a regular basis the GAAP performance of each segment, including the significant segment expenses reported for GAAP shown in the table below. Our significant segment expenses include consolidated expense categories presented in our consolidated statements of operations, as well as rental operating costs. This information is provided to the CODM and factors into the CODM's decision making for company-wide strategy. The following tables compare the Company's segment activity to its results of GAAP operations and financial position as of and for the three months ended March 31, 2026. The information for Corporate and Other are presented to reconcile back to the consolidated statement of operations, but is not considered a reportable segment as noted above.
For the Three Months Ended March 31, 2026 | ||||||||||||||||||||
Retail | Office/Industrial | Model Homes | Corporate and Other | Total | ||||||||||||||||
Revenues: | ||||||||||||||||||||
Rental income | $ | 93,574 | $ | 2,670,580 | $ | 919,890 | $ | - | $ | 3,684,044 | ||||||||||
Fees and other income | - | 82,800 | 5,534 | 422 | 88,756 | |||||||||||||||
Total revenue | 93,574 | 2,753,380 | 925,424 | 422 | 3,772,800 | |||||||||||||||
Costs and expenses: | ||||||||||||||||||||
Rental operating costs | 4,832 | 1,630,837 | 48,877 | (140,105 | ) | 1,544,441 | ||||||||||||||
General and administrative | - | 17,499 | 226,882 | 1,429,442 | 1,673,823 | |||||||||||||||
Depreciation and amortization | 22,928 | 784,276 | 191,292 | 473 | 998,969 | |||||||||||||||
Impairment of goodwill and real estate assets | - | 448,734 | 75,639 | - | 524,373 | |||||||||||||||
Total costs and expenses | 27,760 | 2,881,346 | 542,690 | 1,289,810 | 4,741,606 | |||||||||||||||
Other income (expense): | ||||||||||||||||||||
Interest expense - mortgage notes | (43,117 | ) | (1,543,083 | ) | (462,558 | ) | (1,316 | ) | (2,050,074 | ) | ||||||||||
Interest and other income, net | - | - | 9 | 5,140 | 5,149 | |||||||||||||||
Net loss in Conduit Pharmaceuticals marketable securities (see footnote 9) | - | - | - | 1,985 | 1,985 | |||||||||||||||
Gain on sales of real estate, net | - | - | 172,096 | - | 172,096 | |||||||||||||||
Gain on disposition of assets and liabilities, net | - | 3,416,501 | - | - | 3,416,501 | |||||||||||||||
Income tax (expense) benefit | - | - | (15,657 | ) | (2,400 | ) | (18,057 | ) | ||||||||||||
Total other income (expense), net | (43,117 | ) | 1,873,418 | (306,110 | ) | 3,409 | 1,527,600 | |||||||||||||
Net income (loss) | 22,697 | 1,745,452 | 76,624 | (1,285,979 | ) | 558,794 | ||||||||||||||
Less: Income attributable to noncontrolling interests | - | 2,053 | (119,938 | ) | - | (117,885 | ) | |||||||||||||
Net income (loss) attributable to Presidio Property Trust, Inc. stockholders | $ | 22,697 | $ | 1,747,505 | $ | (43,314 | ) | $ | (1,285,979 | ) | $ | 440,909 |
Subsequent Real Estate Activity:
As of April 24, 2026, the Company amended its agreement with Origin Bank (the lender) through its partnership with Dubose Model Homes #207 LP. The terms of the new amendment decrease the floor interest rate by 1.5 percentage points from its original value while requiring that the Company and DMH#207 LP maintain liquid assets of $200,000 on a quarterly basis, starting March 31, 2026.
About Presidio Property Trust
Presidio is an internally managed, diversified REIT with holdings in model home properties which are triple-net leased to homebuilders, office, industrial, and retail properties. Presidio's model homes are leased to homebuilders located primarily in the sun belt states. Presidio's office, industrial, and retail properties are located primarily in Colorado, with properties also located in Maryland, North Dakota, Texas, and Southern California. For more information on Presidio, please visit Presidio's website at https://www.PresidioPT.com.
Definitions
Non-GAAP Financial Measures
Funds from Operations ("FFO") - The Company evaluates performance based on Funds From Operations, which we refer to as FFO, as management believes that FFO represents the most accurate measure of activity and is the basis for distributions paid to equity holders. The Company defines FFO as net income or loss (computed in accordance with GAAP), excluding gains (or losses) from sales of property, hedge ineffectiveness, acquisition costs of newly acquired properties that are not capitalized and lease acquisition costs that are not capitalized plus depreciation and amortization, including amortization of acquired above and below market lease intangibles and impairment charges on properties or investments in non-consolidated REITs, and after adjustments to exclude equity in income or losses from, and, to include the proportionate share of FFO from, non-consolidated REITs.
However, because FFO excludes depreciation and amortization as well as the changes in the value of the Company's properties that result from use or market conditions, each of which have real economic effects and could materially impact the Company's results from operations, the utility of FFO as a measure of the Company's performance is limited. In addition, other REITs may not calculate FFO in accordance with the NAREIT definition as the Company does, and, accordingly, the Company's FFO may not be comparable to other REITs' FFO. Accordingly, FFO should be considered only as a supplement to net income as a measure of the Company's performance.
Core Funds from Operations ("Core FFO") - We calculate Core FFO by using FFO as defined by NAREIT and adjusting for certain other non-core items. We exclude from our Core FFO calculation acquisition costs, loss on early extinguishment of debt, changes in the fair value of the earn-out, changes in fair value of contingent consideration, non-cash warrant dividends, other non-recuring expenses, and the amortization of stock-based compensation.
We believe Core FFO provides a useful metric in comparing operations between reporting periods and in assessing the sustainability of our ongoing operating performance. Other equity REITs may calculate Core FFO differently or not at all, and, accordingly, the Company's Core FFO may not be comparable to such other REITs' Core FFO.
Cautionary Note Regarding Forward-Looking Statements
This press release contains statements that are "forward-looking statements" within the meaning of the Private Securities Litigation Reform Act of 1995, Section 27A of the Securities Act of 1933, as amended, and Section 21E of the Securities Exchange Act of 1934, as amended, and other federal securities laws. Forward-looking statements are statements that are not historical, including statements regarding management's intentions, beliefs, expectations, representations, plans or predictions of the future, and are typically identified by such words as "believe," "expect," "anticipate," "intend," "estimate," "may," "will," "should" and "could." Because such statements include risks, uncertainties and contingencies, actual results may differ materially from those expressed or implied by such forward-looking statements. These forward-looking statements are based upon the Company's present expectations, but these statements are not guaranteed to occur. Except as required by law, the Company disclaims any obligation to publicly update or revise any forward-looking statement to reflect changes in underlying assumptions or factors, of new information, data or methods, future events or other changes. Investors should not place undue reliance upon forward-looking statements. For further discussion of the factors that could affect outcomes, please refer to the "Risk Factors" section of the Company's documents filed with the SEC, copies of which are available on the SEC's website, www.sec.gov.
Investor Relations Contact:
Presidio Property Trust, Inc.
Lowell Hartkorn, Investor Relations
Telephone: (760) 471-8536 x1244
Presidio Property Trust, Inc. and Subsidiaries
Consolidated Balance Sheet
March 31, | December 31, | |||||||
2026 | 2025 | |||||||
(unaudited) | ||||||||
ASSETS | ||||||||
Real estate assets and lease intangibles: | ||||||||
Land | $ | 13,789,653 | $ | 16,390,250 | ||||
Buildings and improvements | 82,684,544 | 101,878,107 | ||||||
Tenant improvements | 11,435,230 | 17,645,103 | ||||||
Lease intangibles | 1,400,602 | 3,467,798 | ||||||
Real estate assets and lease intangibles held for investment, cost | 109,310,029 | 139,381,258 | ||||||
Accumulated depreciation and amortization | (26,266,550 | ) | (37,536,809 | ) | ||||
Real estate assets and lease intangibles held for investment, net | 83,043,479 | 101,844,449 | ||||||
Real estate assets held for sale, net | 17,451,127 | 6,805,255 | ||||||
Real estate assets, net | 100,494,606 | 108,649,704 | ||||||
Other assets: | ||||||||
Cash, cash equivalents and restricted cash | 5,171,903 | 7,422,359 | ||||||
Deferred leasing costs, net | 1,230,452 | 1,340,853 | ||||||
Goodwill | 1,317,000 | 1,317,000 | ||||||
Investment in Conduit Pharmaceuticals marketable securities (see Notes 2 & 9) | 5,885 | 3,900 | ||||||
Deferred tax asset | 223,388 | 223,388 | ||||||
Other assets, net (see Note 6) | 2,803,541 | 3,095,670 | ||||||
Total other assets | 10,752,169 | 13,403,170 | ||||||
TOTAL ASSETS (1) | $ | 111,246,775 | $ | 122,052,874 | ||||
LIABILITIES AND EQUITY | ||||||||
Liabilities: | ||||||||
Mortgage notes payable, net | $ | 64,160,535 | $ | 81,936,586 | ||||
Mortgage notes payable related to real estate assets held for sale, net | 17,473,032 | 10,137,781 | ||||||
Mortgage notes payable, total net | 81,633,567 | 92,074,367 | ||||||
Accounts payable and accrued liabilities | 3,044,512 | 3,302,187 | ||||||
Accrued real estate taxes | 1,378,644 | 1,785,029 | ||||||
Dividends payable | - | 190,220 | ||||||
Lease liability, net | 33,756 | 40,108 | ||||||
Below-market leases, net | 2,073 | 3,316 | ||||||
Total liabilities | 86,092,552 | 97,395,227 | ||||||
Commitments and contingencies (see Note 10) | ||||||||
Equity: | ||||||||
Series D Preferred Stock, $0.01 par value per share; 1,000,000 shares authorized; 973,736 shares issued and outstanding (liquidation preference $25.00 per share) as of March 31, 2026 and 973,736 shares issued and outstanding as of December 31, 2025 | 9,737 | 9,737 | ||||||
Series A Common Stock, $0.01 par value per share, shares authorized: 100,000,000; 1,314,159 shares and 1,314,159 shares were issued and outstanding as of March 31, 2026 and December 31, 2025, respectively | 13,142 | 13,142 | ||||||
Additional paid-in capital | 186,954,022 | 186,762,388 | ||||||
Dividends and accumulated losses | (169,504,393 | ) | (169,945,302 | ) | ||||
Total stockholders' equity before noncontrolling interest | 17,472,508 | 16,839,965 | ||||||
Noncontrolling interest | 7,681,715 | 7,817,682 | ||||||
Total equity | 25,154,223 | 24,657,647 | ||||||
TOTAL LIABILITIES AND EQUITY | $ | 111,246,775 | $ | 122,052,874 |
Presidio Property Trust, Inc. and Subsidiaries
Consolidated Statements of Operations
For the Three Months Ended March 31, | ||||||||
2026 | 2025 | |||||||
Revenues: | ||||||||
Rental income | $ | 3,684,044 | $ | 4,032,429 | ||||
Fees and other income | 88,756 | 92,755 | ||||||
Total revenue | 3,772,800 | 4,125,184 | ||||||
Costs and expenses: | ||||||||
Rental operating costs | 1,544,441 | 1,612,642 | ||||||
General and administrative | 1,673,823 | 1,661,978 | ||||||
Depreciation and amortization | 998,969 | 1,244,104 | ||||||
Impairment of goodwill and real estate assets | 524,373 | 26,943 | ||||||
Total costs and expenses | 4,741,606 | 4,545,667 | ||||||
Other income (expense): | ||||||||
Interest expense - mortgage notes | (2,050,074 | ) | (1,510,470 | ) | ||||
Net gain (loss) in Conduit Pharmaceuticals marketable securities (see Note 9) | 1,985 | (176,658 | ) | |||||
Interest and other income, net | 5,149 | 5,149 | ||||||
Gain on sales of real estate, net | 172,096 | 4,453,968 | ||||||
Gain on disposition of assets and liabilities, net | 3,416,501 | - | ||||||
Income tax (expense) benefit | (18,057 | ) | 25,409 | |||||
Total other income (expense), net | 1,527,600 | 2,797,398 | ||||||
Net income | 558,794 | 2,376,915 | ||||||
Less: Income attributable to noncontrolling interests | (117,885 | ) | (111,563 | ) | ||||
Net income attributable to Presidio Property Trust, Inc. stockholders | $ | 440,909 | $ | 2,265,352 | ||||
Less: Series D Preferred Stock declared dividends | - | (579,575 | ) | |||||
Less: Series D Preferred Stock undeclared dividends in arrears | (570,541 | ) | - | |||||
Net (loss) income attributable to Presidio Property Trust, Inc. common stockholders | $ | (129,632 | ) | $ | 1,685,777 | |||
Net (loss) income per share attributable to Presidio Property Trust, Inc. common stockholders: | ||||||||
Basic & Diluted | $ | (0.10 | ) | $ | 1.31 | |||
Weighted average number of common shares outstanding - basic & dilutive | 1,314,159 | 1,283,432 |
FFO AND CORE FFO RECONCILIATION
For the Three Months Ended March 31, | ||||||||
2026 | 2025 | |||||||
Net (loss) income attributable to Presidio Property Trust, Inc. common stockholders | $ | (129,632 | ) | $ | 1,685,777 | |||
Adjustments: | ||||||||
Income attributable to noncontrolling interests | 117,885 | 111,563 | ||||||
Depreciation and amortization | 998,969 | 1,244,104 | ||||||
Amortization of above and below market leases, net | (1,244 | ) | (1,022 | ) | ||||
Impairment of real estate assets | 524,373 | 26,943 | ||||||
Loss on marketable securities | (1,985 | ) | 176,658 | |||||
Net gain on sale of real estate assets | (172,096 | ) | (4,453,968 | ) | ||||
Gain on extinguishment of debt | (3,416,501 | ) | - | |||||
FFO | $ | (2,080,231 | ) | $ | (1,209,945 | ) | ||
Stock Based Compensation | 191,633 | 229,502 | ||||||
Core FFO | $ | (1,888,598 | ) | $ | (980,443 | ) | ||
Weighted average number of common shares outstanding - basic and diluted | 1,314,159 | 1,283,432 | ||||||
Core FFO / Wgt Avg Share | $ | (1.44 | ) | $ | (0.76 | ) |
SOURCE: Presidio Property Trust
View the original press release on ACCESS Newswire


